Global equities continued their positive momentum from May, ending June +2.4% higher as measured by the MSCI All Country World Index (all returns are in local currency terms unless stated). The positive momentum was largely driven by the US market, in particular mega-cap US technology stocks with connections to the artificial intelligence theme. The US’s tech-laden NASDAQ Composite Index finished +5.9% higher, while the largely technology free Dow Jones was more subdued, ending up +1.1% over the month.
Outside these markets which are dominated by the mega-cap names, the S&P SmallCap 600 Index declined -2.3%. Economic data released over the month was mixed, however importantly, US inflation remained unchanged in May, increasing the possibility that the US Federal Reserve may start cutting interest rates later this year.
Outside the US, share markets were mixed over June. The UK’s FTSE dropped -1.3%, while in Europe only 3 of the 16 countries in the S&P Europe 350 Index provided a positive return, seeing the Index finish -1.0% lower over the month. The drop in the Europe Index was driven by political uncertainty in France, as the French President Emmanuel Macron called for a snap election. This rattled investor confidence sending the French share market down -6.4% over June.
The end of June marks the half-way point of the year, and for investors it has been a 6-month period of positive returns. However, like the month of June, most of the gains are connected to technology stocks with an association to artificial intelligence. The S&P 500 Index has gained 15.3% since December and has reached new all-time highs 33 times so far this year. The tech-laden Nasdaq is up about 18%, and the largely tech-free Dow Jones has risen a less-impressive 3.8%. Nvidia, Microsoft, Apple, Alphabet, Amazon, Eli Lilly, Meta Platforms and Broadcom have been the driving force behind the strong gains this year, accounting for around 67% of the return of the S&P 500 Index year to date.
Global bonds provided positive returns over June, helped by inflation in the United Kingdom falling from 2.3% back to the Bank of England’s 2% target, the slowest pace since July 2021. It wasn’t all plain sailing for fixed interest however, as the snap election in France sent French bonds tumbling.
The Australian share market gained 1% in June. Inflation is hitting the headlines again in Australia, as the latest inflation data for May showed an unexpectedly large increase to 4.0% up from 3.6%, its fastest growth since November 2023. Closer to home, June was a challenging month for New Zealand equities. Only one third of the market produced a positive return, as the S&P/NZX 50 Index ended -1.3% lower over the month. The monthly decline pulls the year-to-date (ending June) return for the domestic Index into negative territory.
Domestic bonds produced a positive return as the New Zealand economy moved out of technical recession; March quarter GDP came in at a positive +0.2%.
The differing fortunes of various asset classes over the June quarter are illustrated in the chart below.
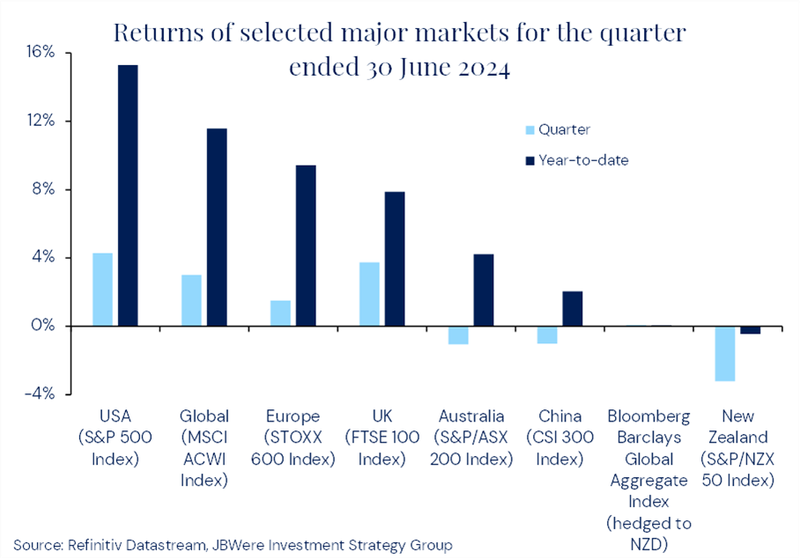
Note: Returns are in local currency terms. The returns over the quarter and year-to-date for the Bloomberg Barclays Global Aggregate Index (Global Fixed Interest) are close to zero and not observable in the chart.
Key points to note in the chart above are:
- June quarter returns were mixed across asset classes
- US equities led global equities forward over the June quarter, and year to date
- limited exposure to technology stocks, a struggling economy, and stubbornly tight local central bank policy, has seen the New Zealand share market underperform global equities.
What this means for our Funds over the June quarter
The chart below shows selected returns for all Funds in the MAS KiwiSaver Scheme. Returns for comparable Funds in the MAS Retirement Savings Scheme and the quarterly returns1 for the comparable Funds in MAS Investment Funds are very similar.
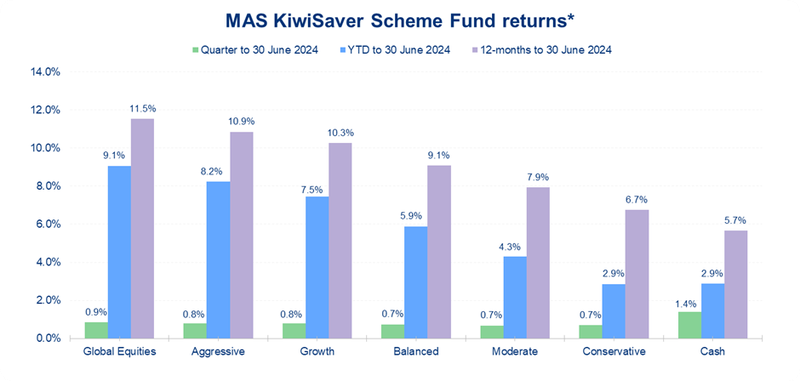
Note: *Returns are after total annual Fund charges and before tax.
Key points to note from the chart above are:
- similar returns were experienced across the Funds over the 3 months ending June 2024.
- growth assets (shares) have outperformed income assets (bonds) over the 6-months and 12-month period, which led to the more growth orientated Funds outperforming the more conservative Funds over these time periods.
- for the more growth- orientated Funds, most of the strong performance experienced over the past 12-months, has been largely driven by equity market returns over the most recent 6-month period.
The outlook
Global equity market performance remains at the whims of competing forces. On one hand, markets are benefiting from a broadly favourable US economic backdrop. There is still resilient economic activity, easing inflation and expectations of the start of an easing cycle from the Federal Reserve later this year. This is combined with the continued excitement surrounding new technologies (particularly artificial intelligence) but also other structural growth stories such as weight-loss drugs. On the other hand, investors have factored these expectations into asset prices and, as a result, valuations remain elevated, increasing the risk of disappointment – particularly on the earnings front. If this favourable economic picture persists, and companies continue to deliver on (increased) expectations, which is conceivable, these high valuations are not an immediate area of concern.
However, at a time when risks remain to the economic outlook from the likes of geopolitics, the risk of earnings disappointment is real and lingering questions remain over the more challenging ‘last mile’ of the disinflation journey. It’s also worth noting there have been a few recent hiccups in some economies, which is why we believe it is prudent to maintain a conservative view towards economic and markets outlook overall. This conservative positioning is something we continue to maintain for the Funds in each of the MAS Schemes.
We have useful online tools to help you:
- Our Fund Finder can help you see if you're in the right Fund for your circumstances.
- Our KiwiSaver Retirement Calculator can help you understand if your retirement savings are on track.
- Our MAS Investor Portal can help you manage your investments online.
If you decide to change your Fund after reviewing your risk profile or meeting with a MAS Adviser, you can make a switch via the MAS Investor Portal, or alternatively you can complete an investment strategy change request form. There is no fee for switching. Links to the relevant forms are below.
- MAS KiwiSaver Scheme: KiwiSaver Documents and Forms – MAS
- MAS Retirement Savings Scheme: Retirement Savings Scheme Documents and Forms – MAS
- MAS Investment Funds: Investment Funds Documentations and Forms
You can see weekly updates on fund unit prices and returns on our website:
- MAS KiwiSaver Scheme: KiwiSaver Funds – MAS
- MAS Retirement Savings Scheme: Retirement Savings Scheme Funds | MAS – MAS
- MAS Investment Funds: Investment Funds – MAS
This article is of a general nature and is not a substitute for professional and individually tailored advice. Medical Funds Management Limited, JBWere (NZ) Pty Ltd and Bancorp Treasury Services Limited, their parent companies and associated entities do not guarantee the return of capital or the performance of investment funds. Returns indicated may bear no relation to future performance. The value of investments will fluctuate as the values of underlying assets rise or fall.
MAS is a financial advice provider. Our financial advice disclosure statement is available by visiting mas.co.nz or by calling 0800 800 627.
The Product Disclosure Statement for the MAS KiwiSaver Scheme is available: KiwiSaver – MAS
The Product Disclosure Statement for the MAS Retirement Savings Scheme is available: Retirement Savings Scheme – MAS
The Product Disclosure Statement for the MAS Investment Funds is available: Investment Funds – MAS
Medical Funds Management Limited is the issuer and manager of the Schemes.
More news
MAS Annual General Meeting 2024
30 July 2024 - MAS invites our Members to join us in-person or online at the MAS Members' Trust Annual General Meeting (AGM) on Wednesday 21 August 2024 at 7pm.
Investment Annual Report 2024 - Highlights
31 July 2024 - Get the highlights from our MAS KiwiSaver Scheme, MAS Retirement Savings Scheme, and MAS Investment Funds Annual Reports